Something a lot of us have asked for is a real signal strength meter. That would help a lot setting up your antenna, and troubleshooting poor reception issues.
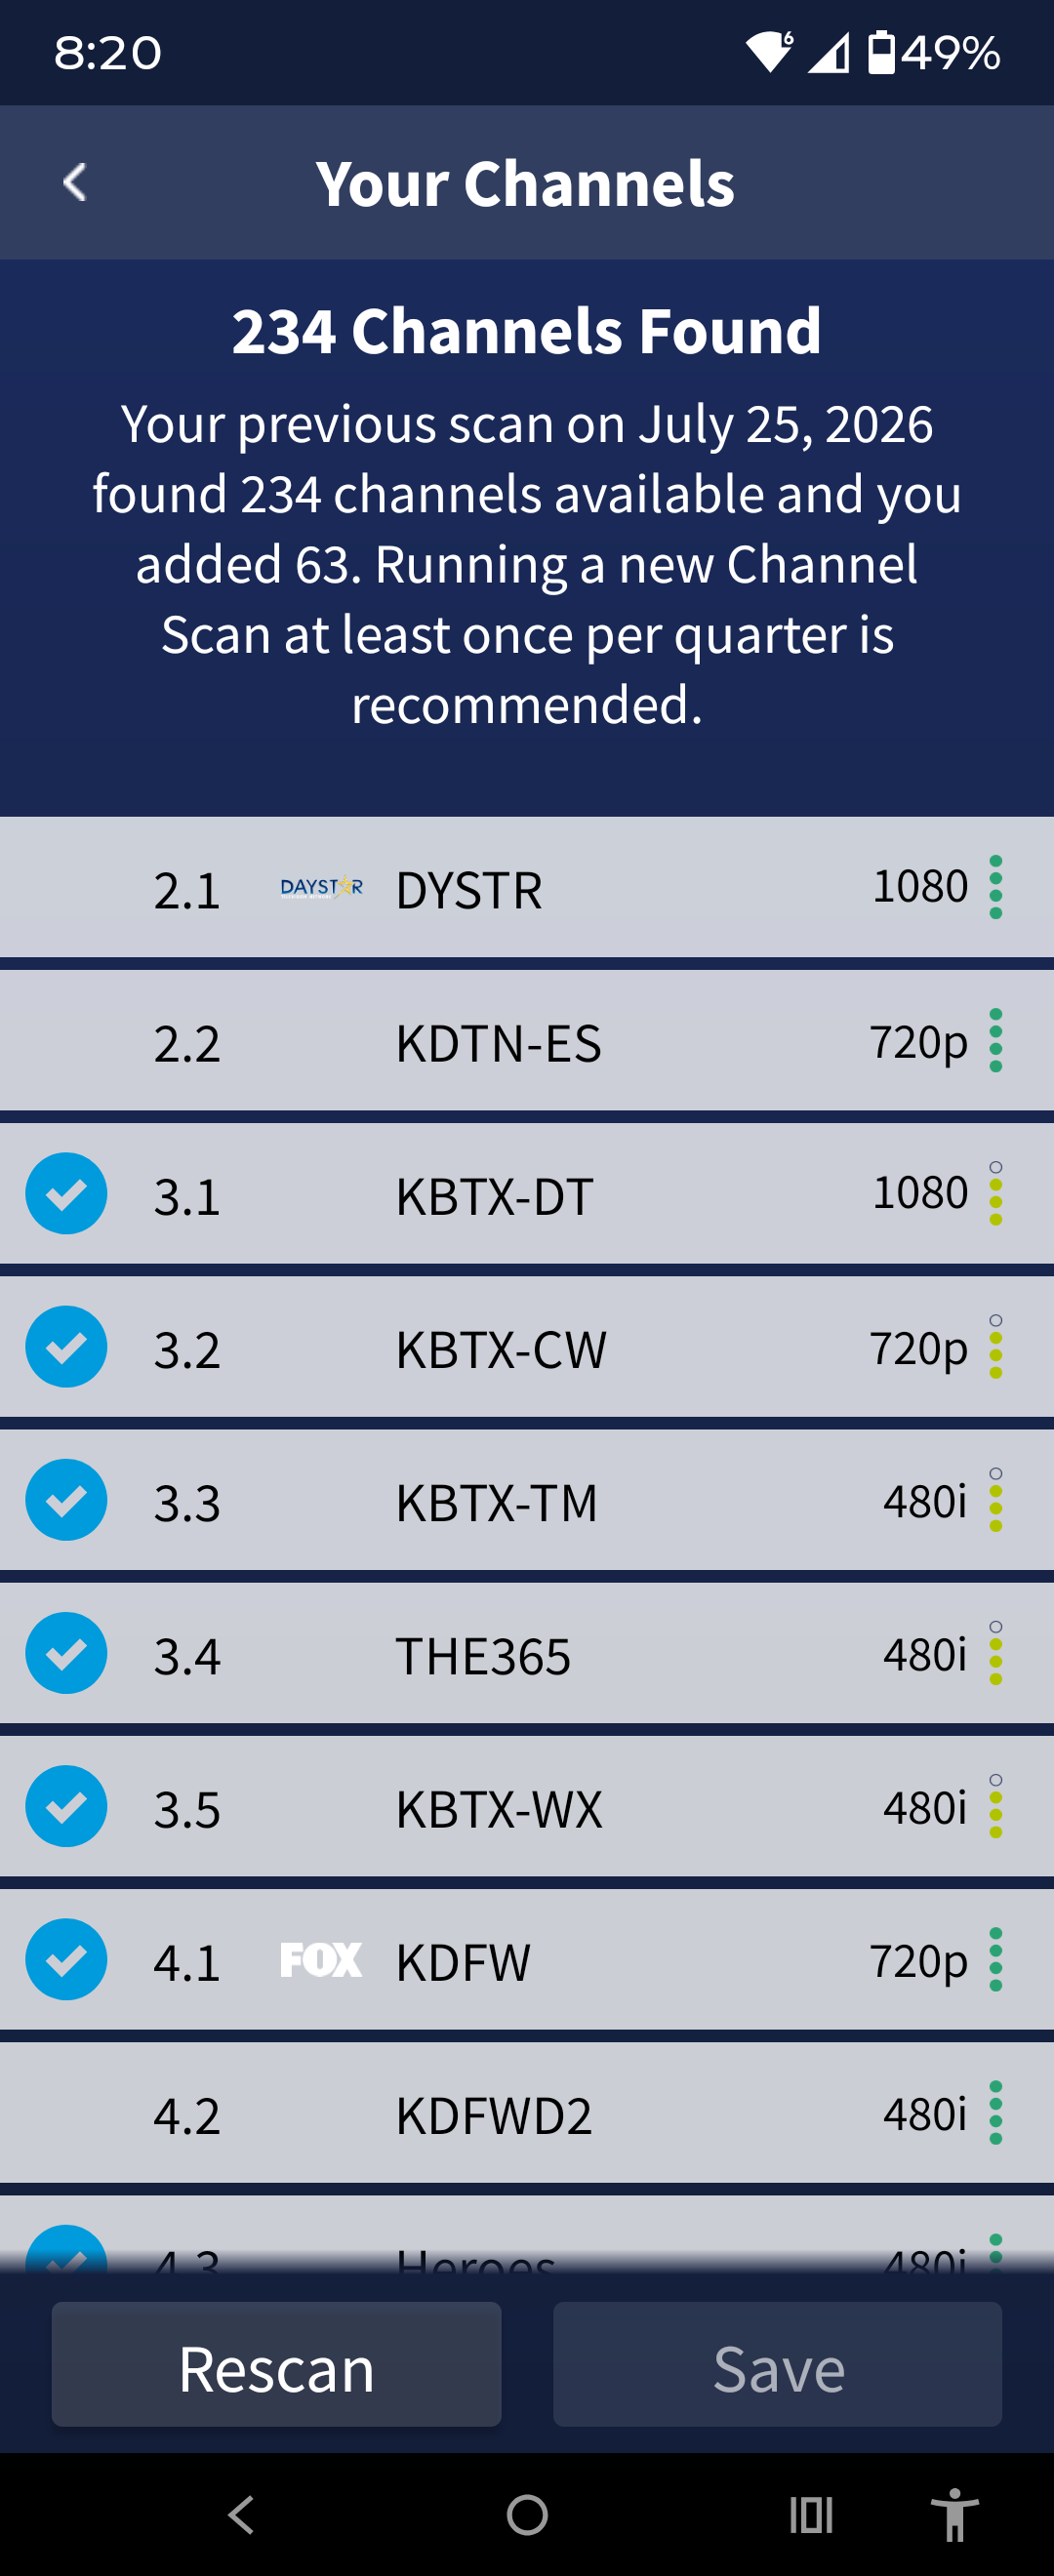
1. That the Your Channels scan/select/save screen would be updated to include numerical Signal Strength that changes colors and SNR calculations that changes colors which would replace the RAG (red, amber, green) stoplight.
The information would then be updated “realtime” (snapshot) when the channel is selected from the guide to watch.
To see the channel strength information you would have to go into the Your Channels view again to see any differences.
Or are you wanting a splash screen type thing that updates/displays when you change channels then vanishes.
Or like when you are watching a channel and press the “up arrow” and all that real estate is available to display everything. On screen realtime. On demand.
@CarbonCompound - These all sound like good additions. However, the Your Channels would have to remain one-time at scan time because, as you’re probably aware, it takes one tuner per real-time channel display. Adding the one-time strength and RF channel to this display would also be helpful. I like your idea of it being updated when the channel is selected, but then you may need to include a time or date it was last updated.
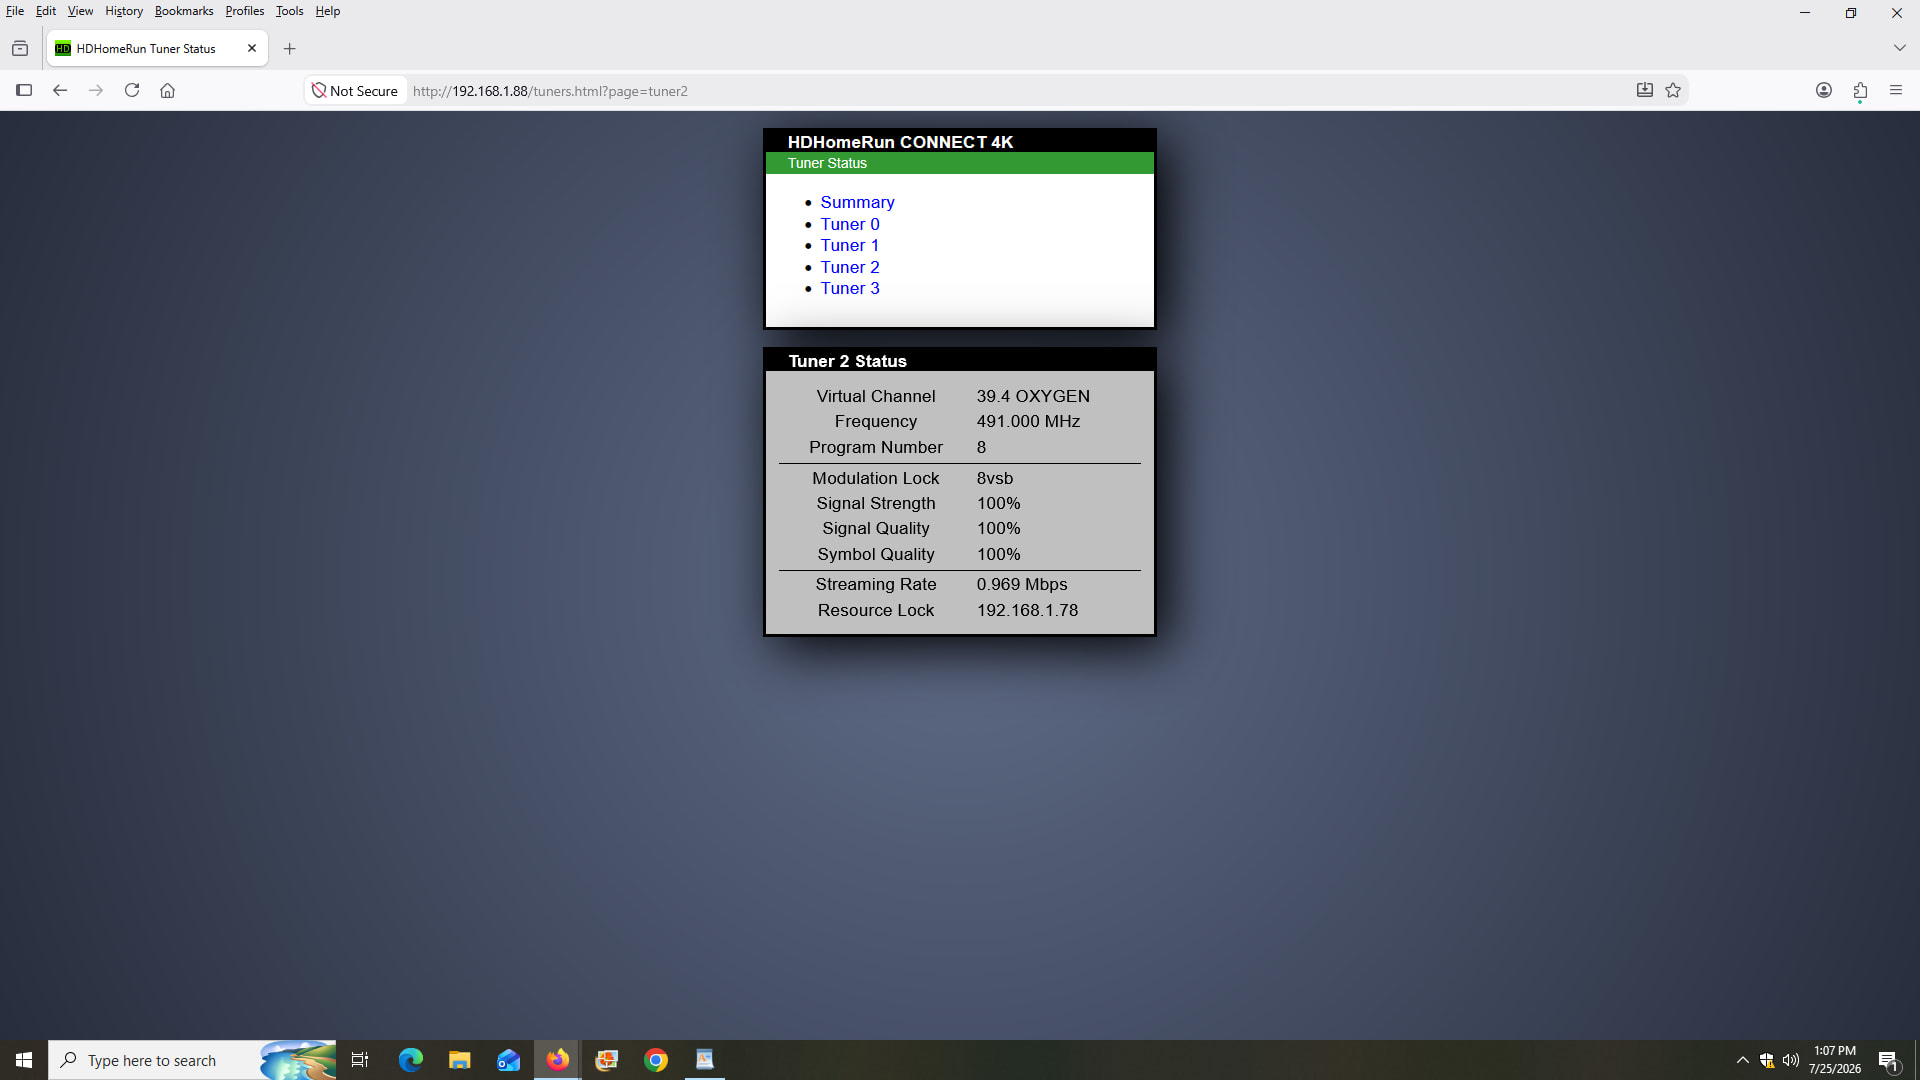
I think most people looking to display the real-time antenna/tuner info on a per channel basis, like #3 and #2.
You must have a TV or other tuner device with a signal meter. The only thing that is meaningful is what is happening in real time. What happened a month, week, day, or even an hour ago doesn’t apply to what is happening this second.
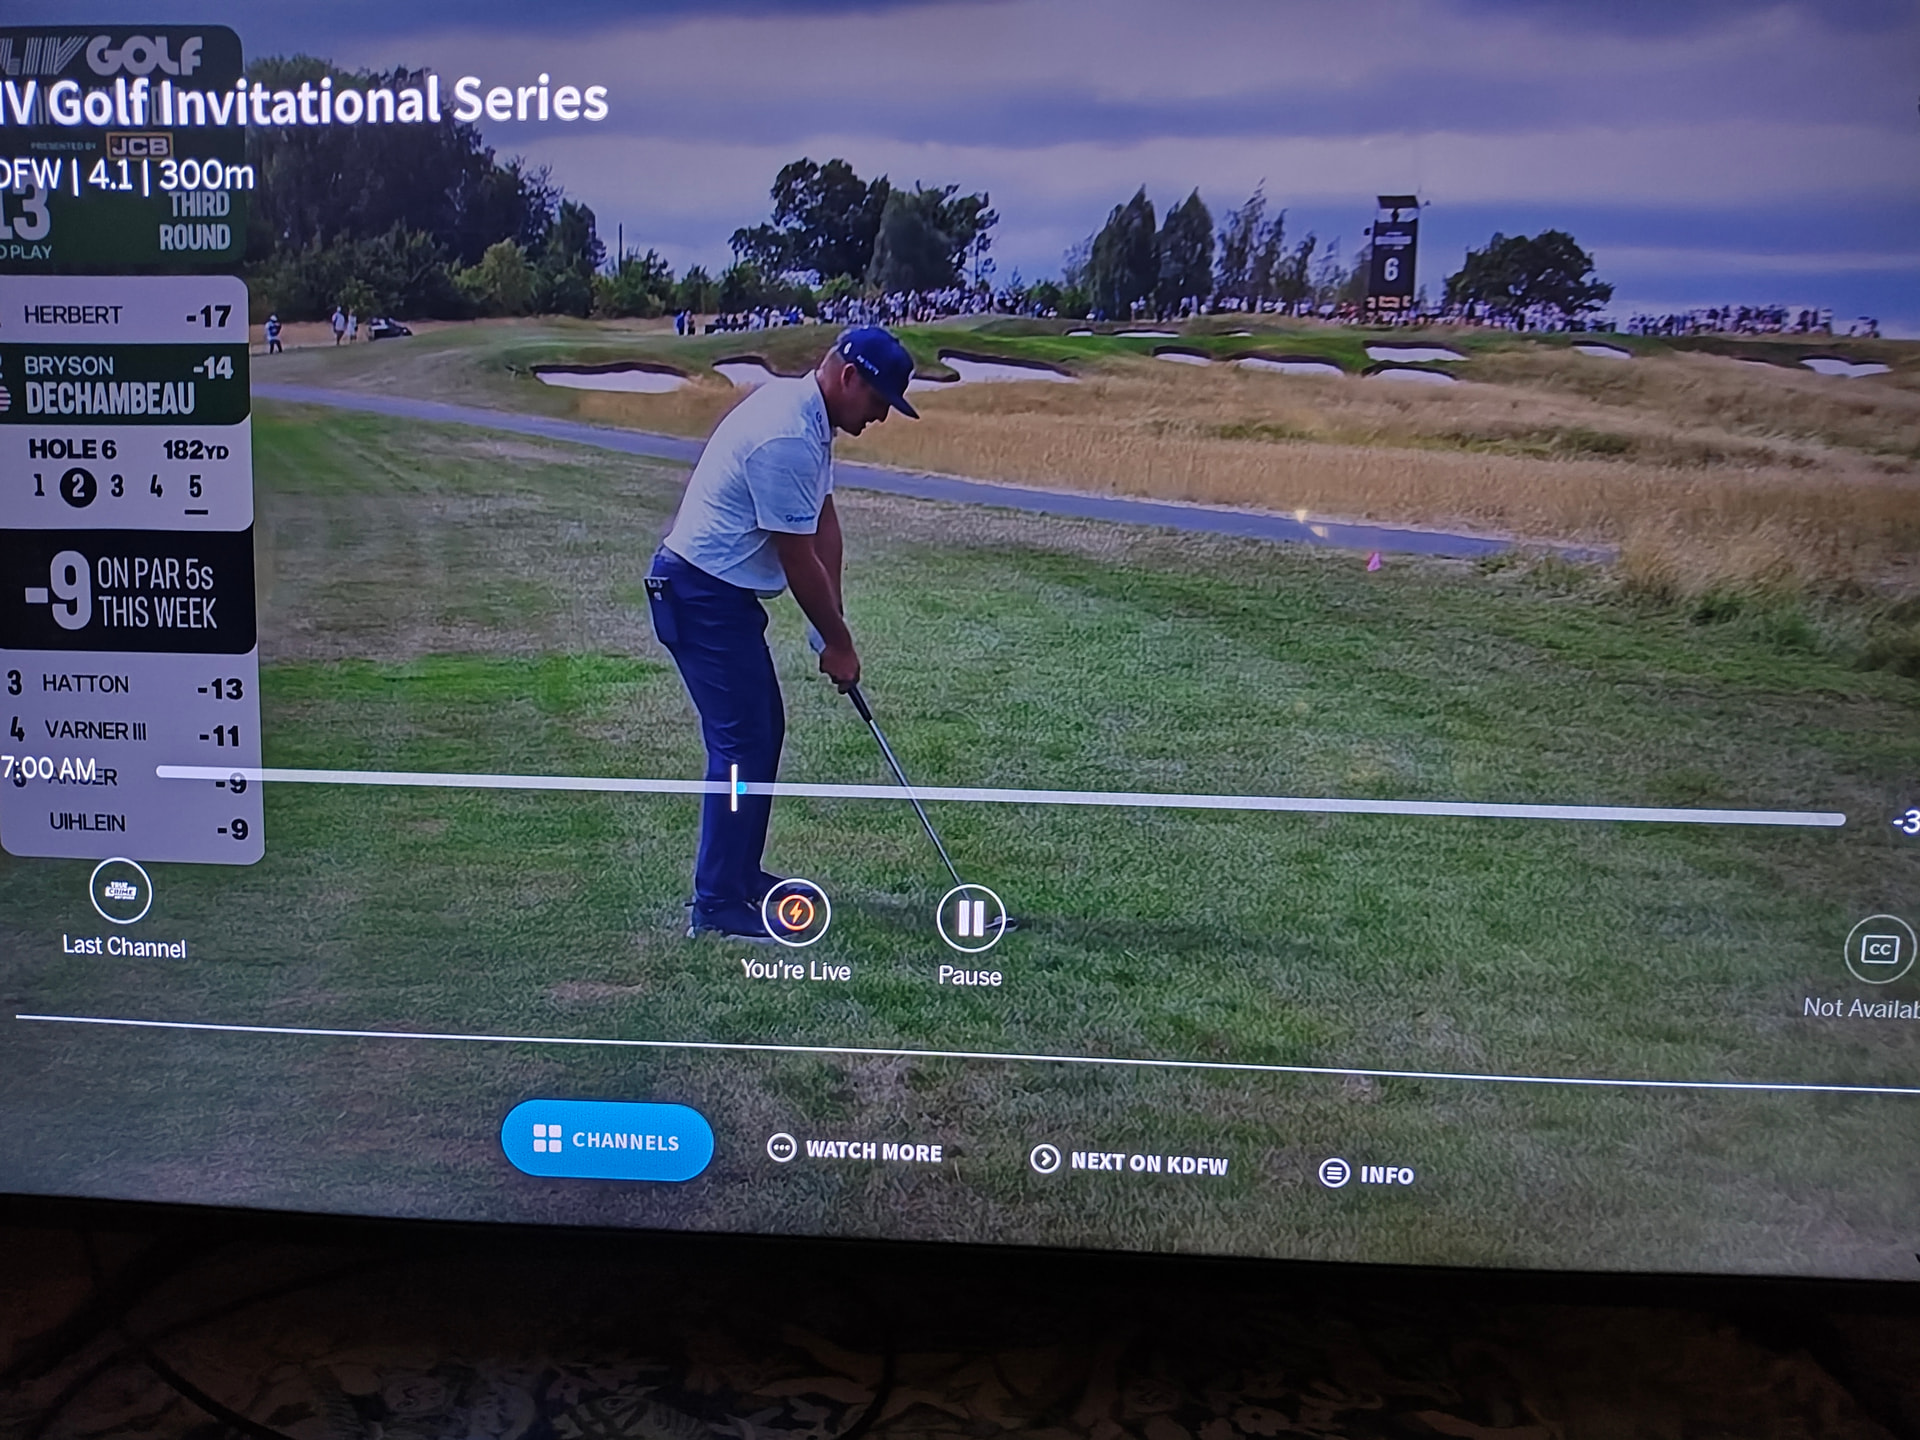
Well I’m for leaving everything as it is and then #3 would be the simpler solution. The Signal Strength and SNR calculations are being done realtime anyway during decoding. So just display the data on the “up arrow” screen.
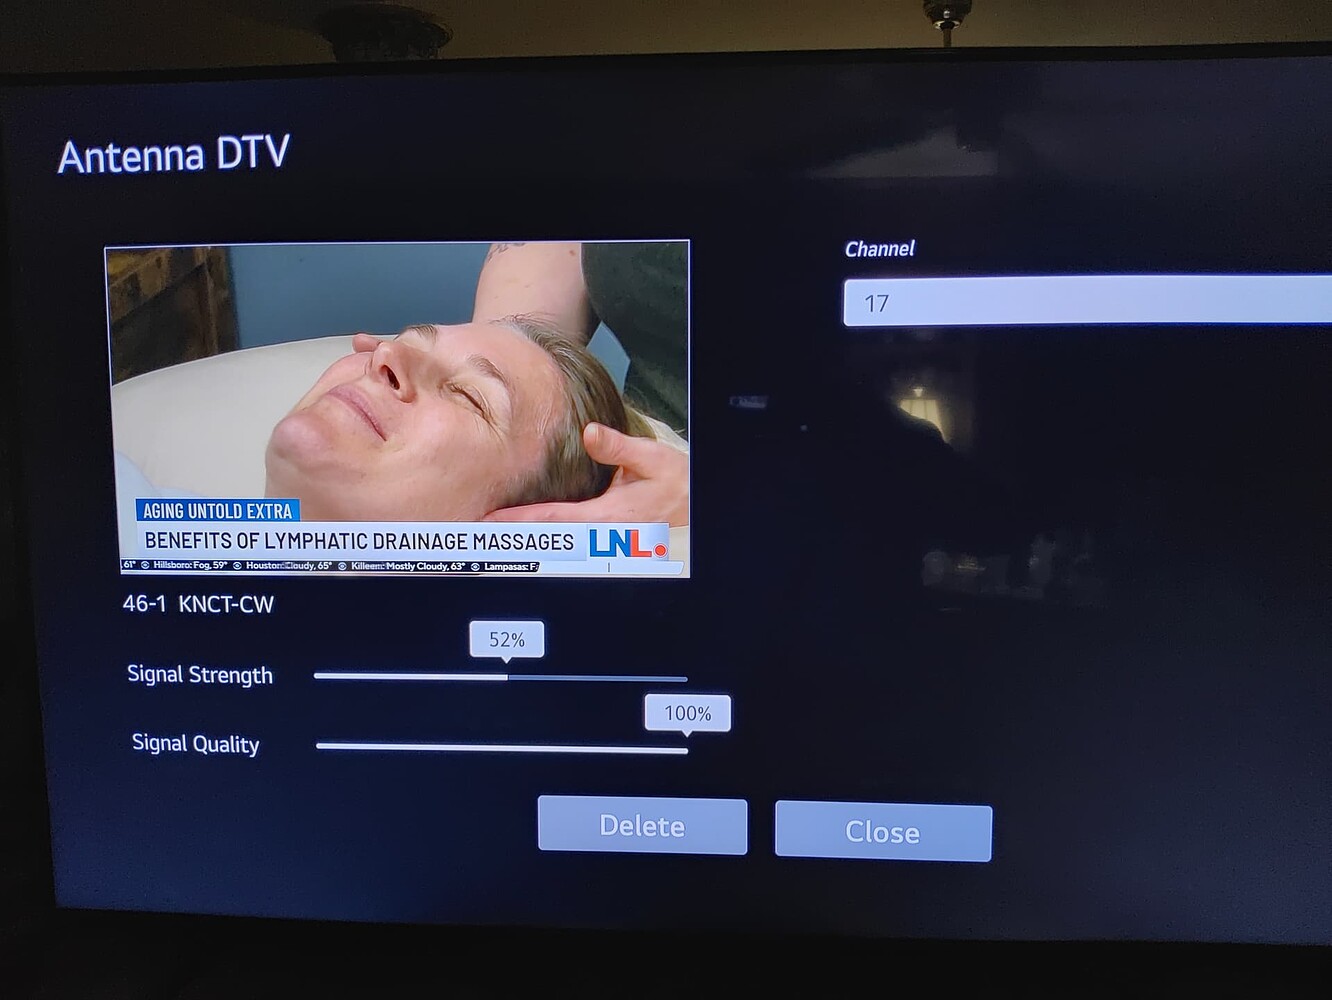
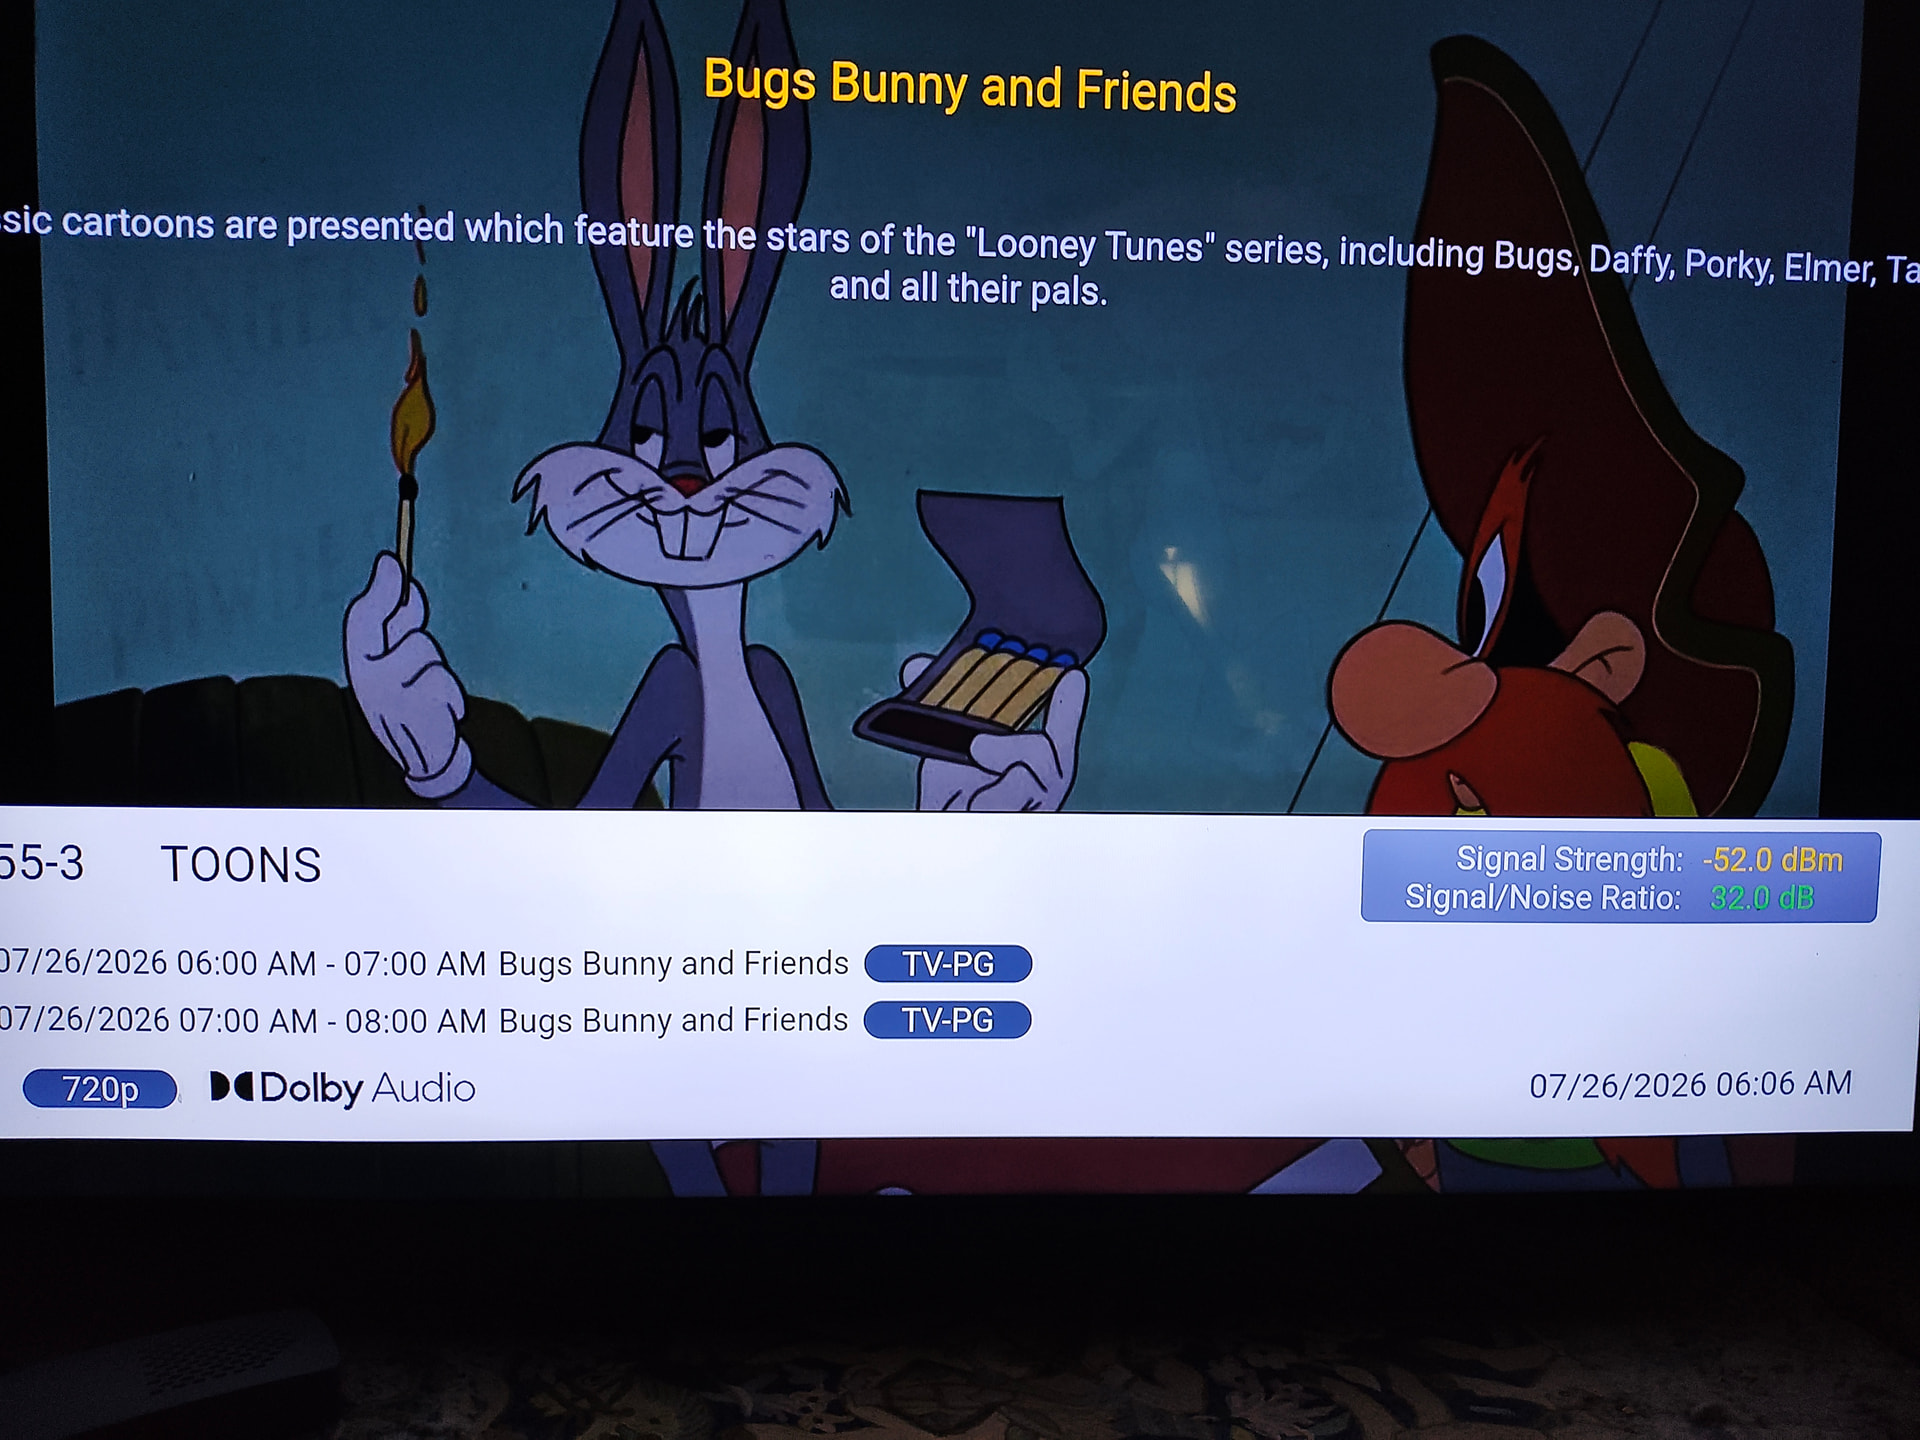
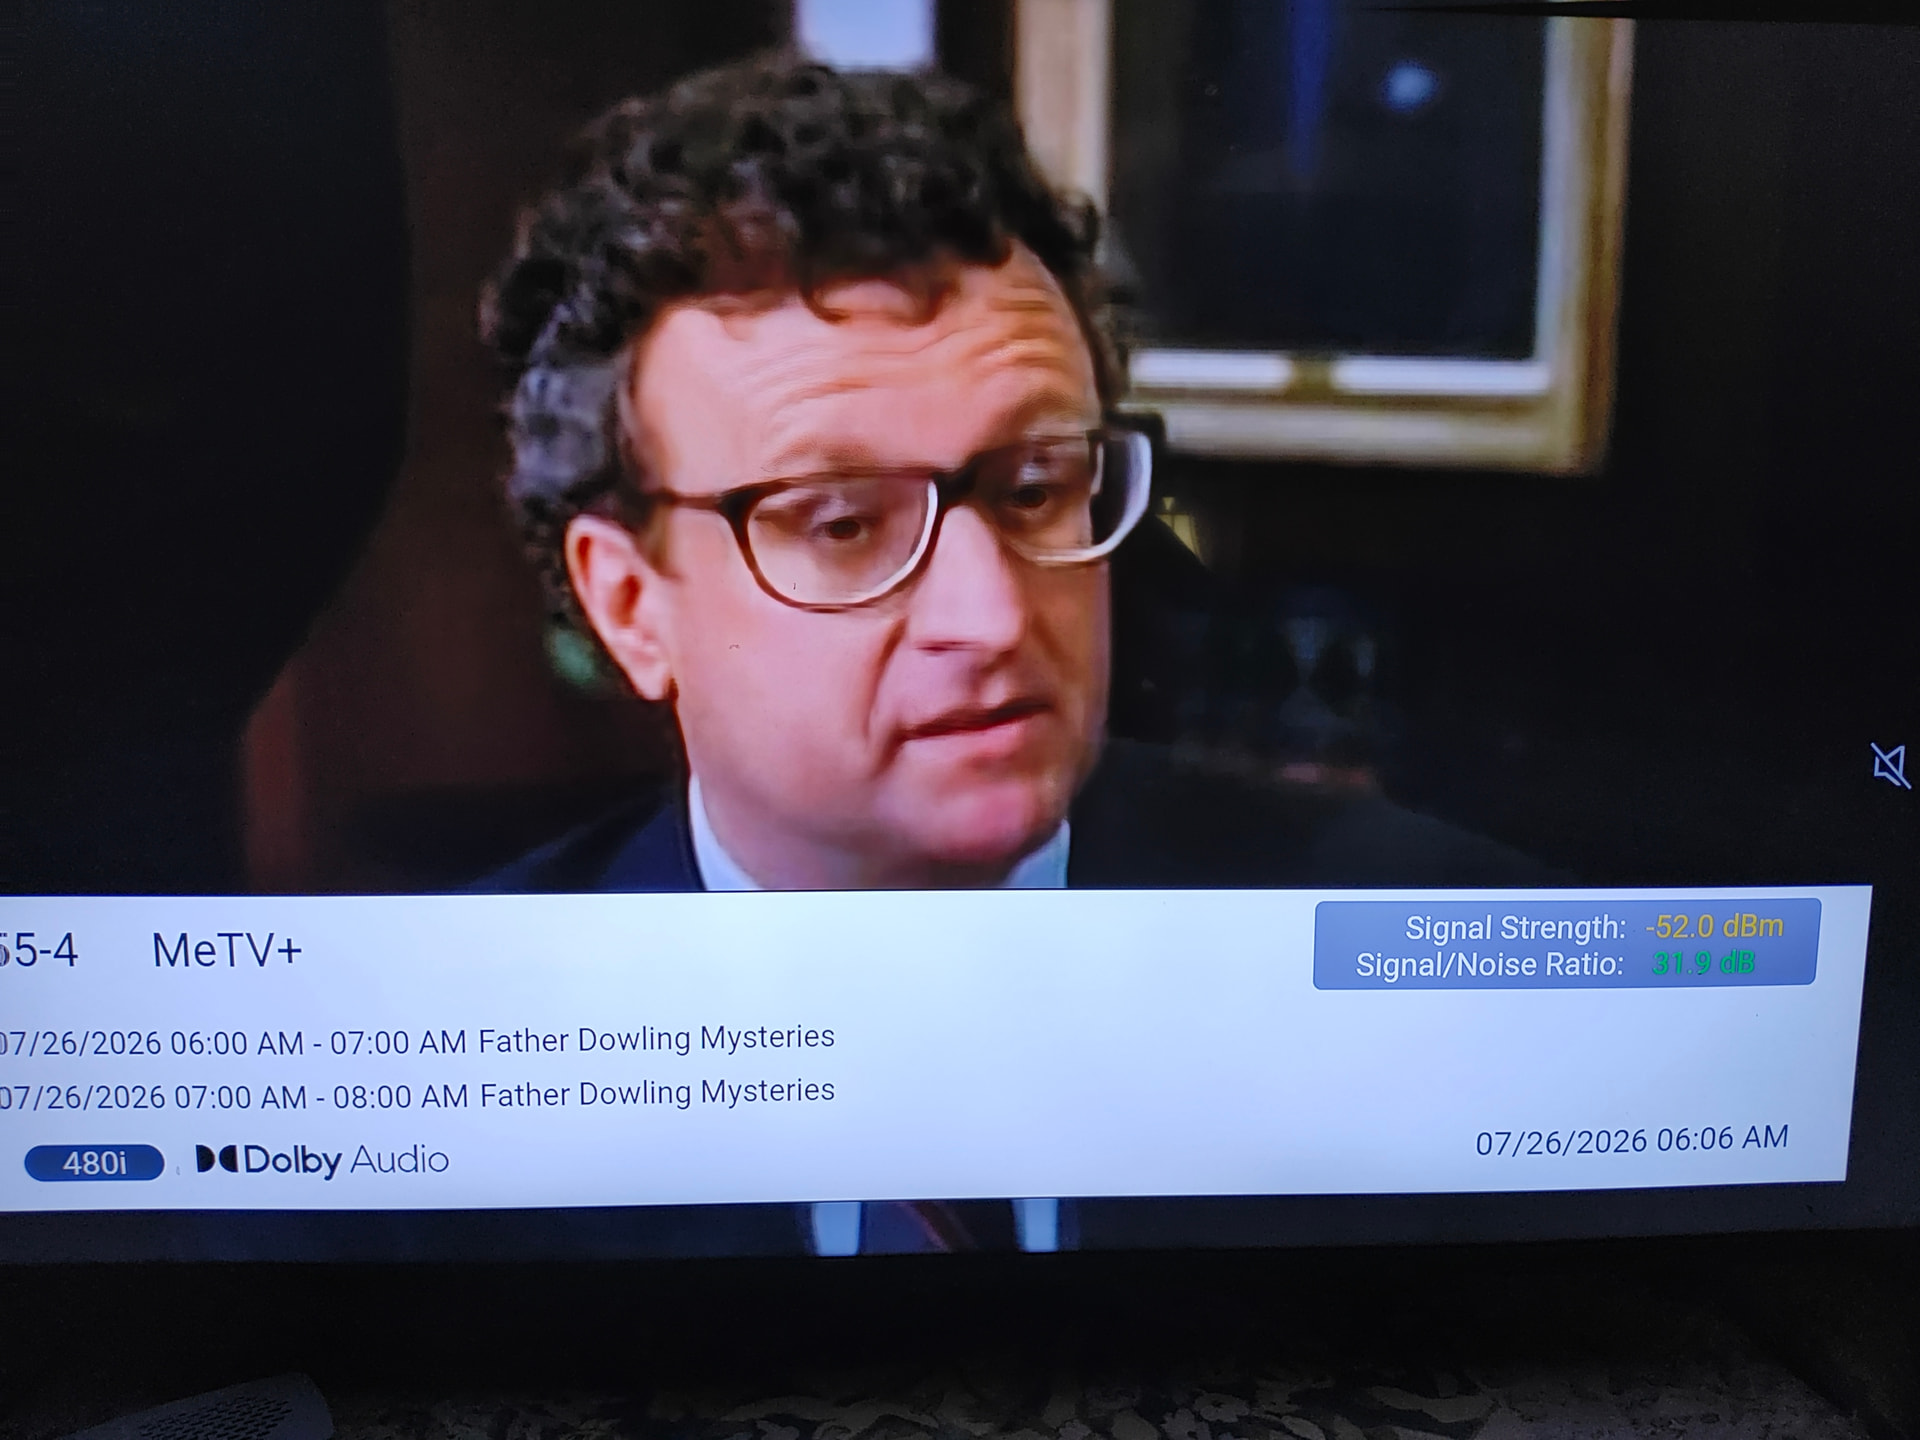
This is the basic signal meter for my LGTV SS/SQ… I think I prefer the Zinwell 600B meter. The first is from pressing the “info” button with program description. The other is a channel change that popped up then disappeared.
Yes, the dBm and SNR values would be what I would be looking for. Only I would prefer to see a graph and the peak value for signal strength.
Also, on Samsung, I can put in the physical channel number and if there isn’t already a HDTV virtual channel using it, then it will attempt to tune in that physical channel.
I don’t expect to the number to be immediate to the second real time. I don’t know if the ATSC tuner passes along diagnostic information immediately or attached historically with the immediate video/audio codec frame. But even a couple seconds of delay would be much better. Right now a channel scan takes 90 seconds each time to get results and needs to be manually requested to run again.
I think per station meta data and wifi troubleshooting should each be given their own “Advanced Settings” screen that are each separate and focused on their own task.
So, for Antenna positioning screen:
Physical RF Channel Number/MHz attempting to set the tuner to
Graph of dBm strength
Graph of Signal to Noise Ratio (SNR)
Virtual channel number (if received)
ZIP code the Tablo is set to
If the Tablo client is on a GPS capable device, then LAT and LONG of the device and recommended compass angle to put the antenna
For TV channel metadata screen:
TV Call Sign
ATSC Virtual TV channel and sub-channel numbers
Video and audio codecs
Resolution and interlace/progressive
Source of Over The Air (OTA) or FAST
Can Record status
TMS station ID # (useful for Gracenote troubleshooting)
Average bitrate for the last 1 minute of content
And then a Wifi/network troubleshooting screen:
Wifi connection type (802.11ac, 11n, 11a, 11g, etc)
It shouldn’t just be viewed as an “initial setup” thing. I consider it a major disappointment of the My Tablo application that it is treated as an initial set it and forget it.
Reality is very different.
People’s interest in stations change over time. A new prime time program may suddenly make a station previously disregarded important (along with the quality of the reception).
Weather can drop a large tree limb on an outdoor antenna requiring it to be replaced.
The positioning of an antenna may get bumped when a contractor replaces roofing shingles.
Once the initial setup is done, all that the app provides from that point forward is if the built-in amplifier is on or off (and a 90+ second rescan).
I agree that this should be seen as a way to reduce customer technical support load and improve customer satisfaction.
I miss this feature after switching from TiVo. I would absolutely love to have a signal strength meter that I could pull up and check on the current signal strength of a selected channel.
The real-time meter would be good for optimizing the broadcast signal, for any reason, relative to the current location of the antenna. If it could make a pinging sound (slower for bad and faster for good), it would be even better so then you could adjust your remote antenna without having to look at the output on the screen. I know - pipe dream.
I’m surprised that members of this community haven’t voted this one up higher than it is.
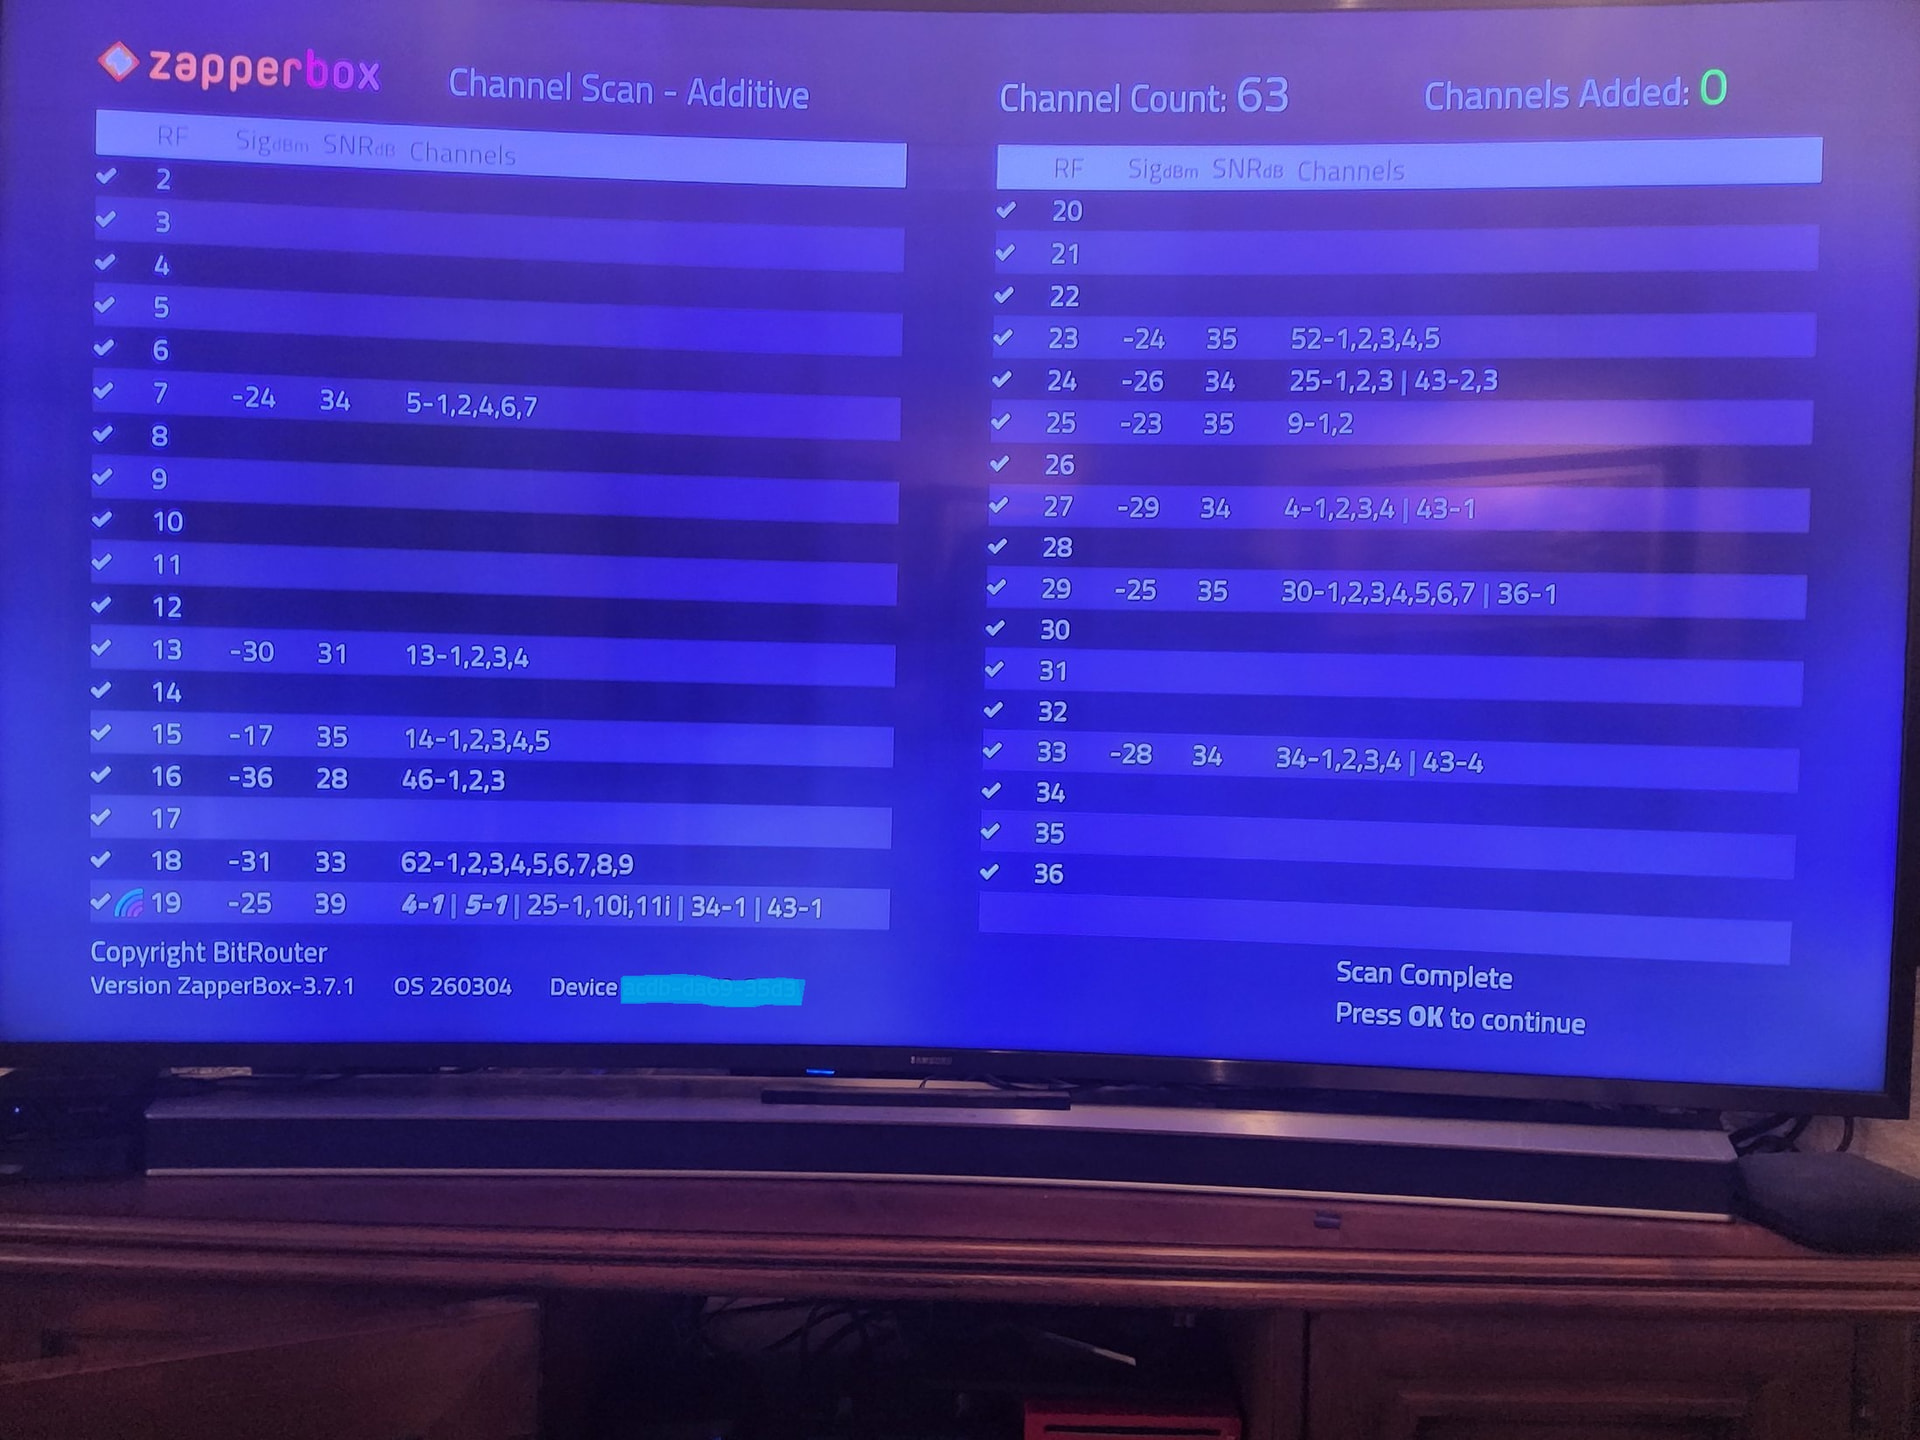
Zapperbox can do a new channel scan, an additive channel scan and a single frequency channel scan. It shows the actual Signal Strength and Signal to Noise Ratio for each frequency.
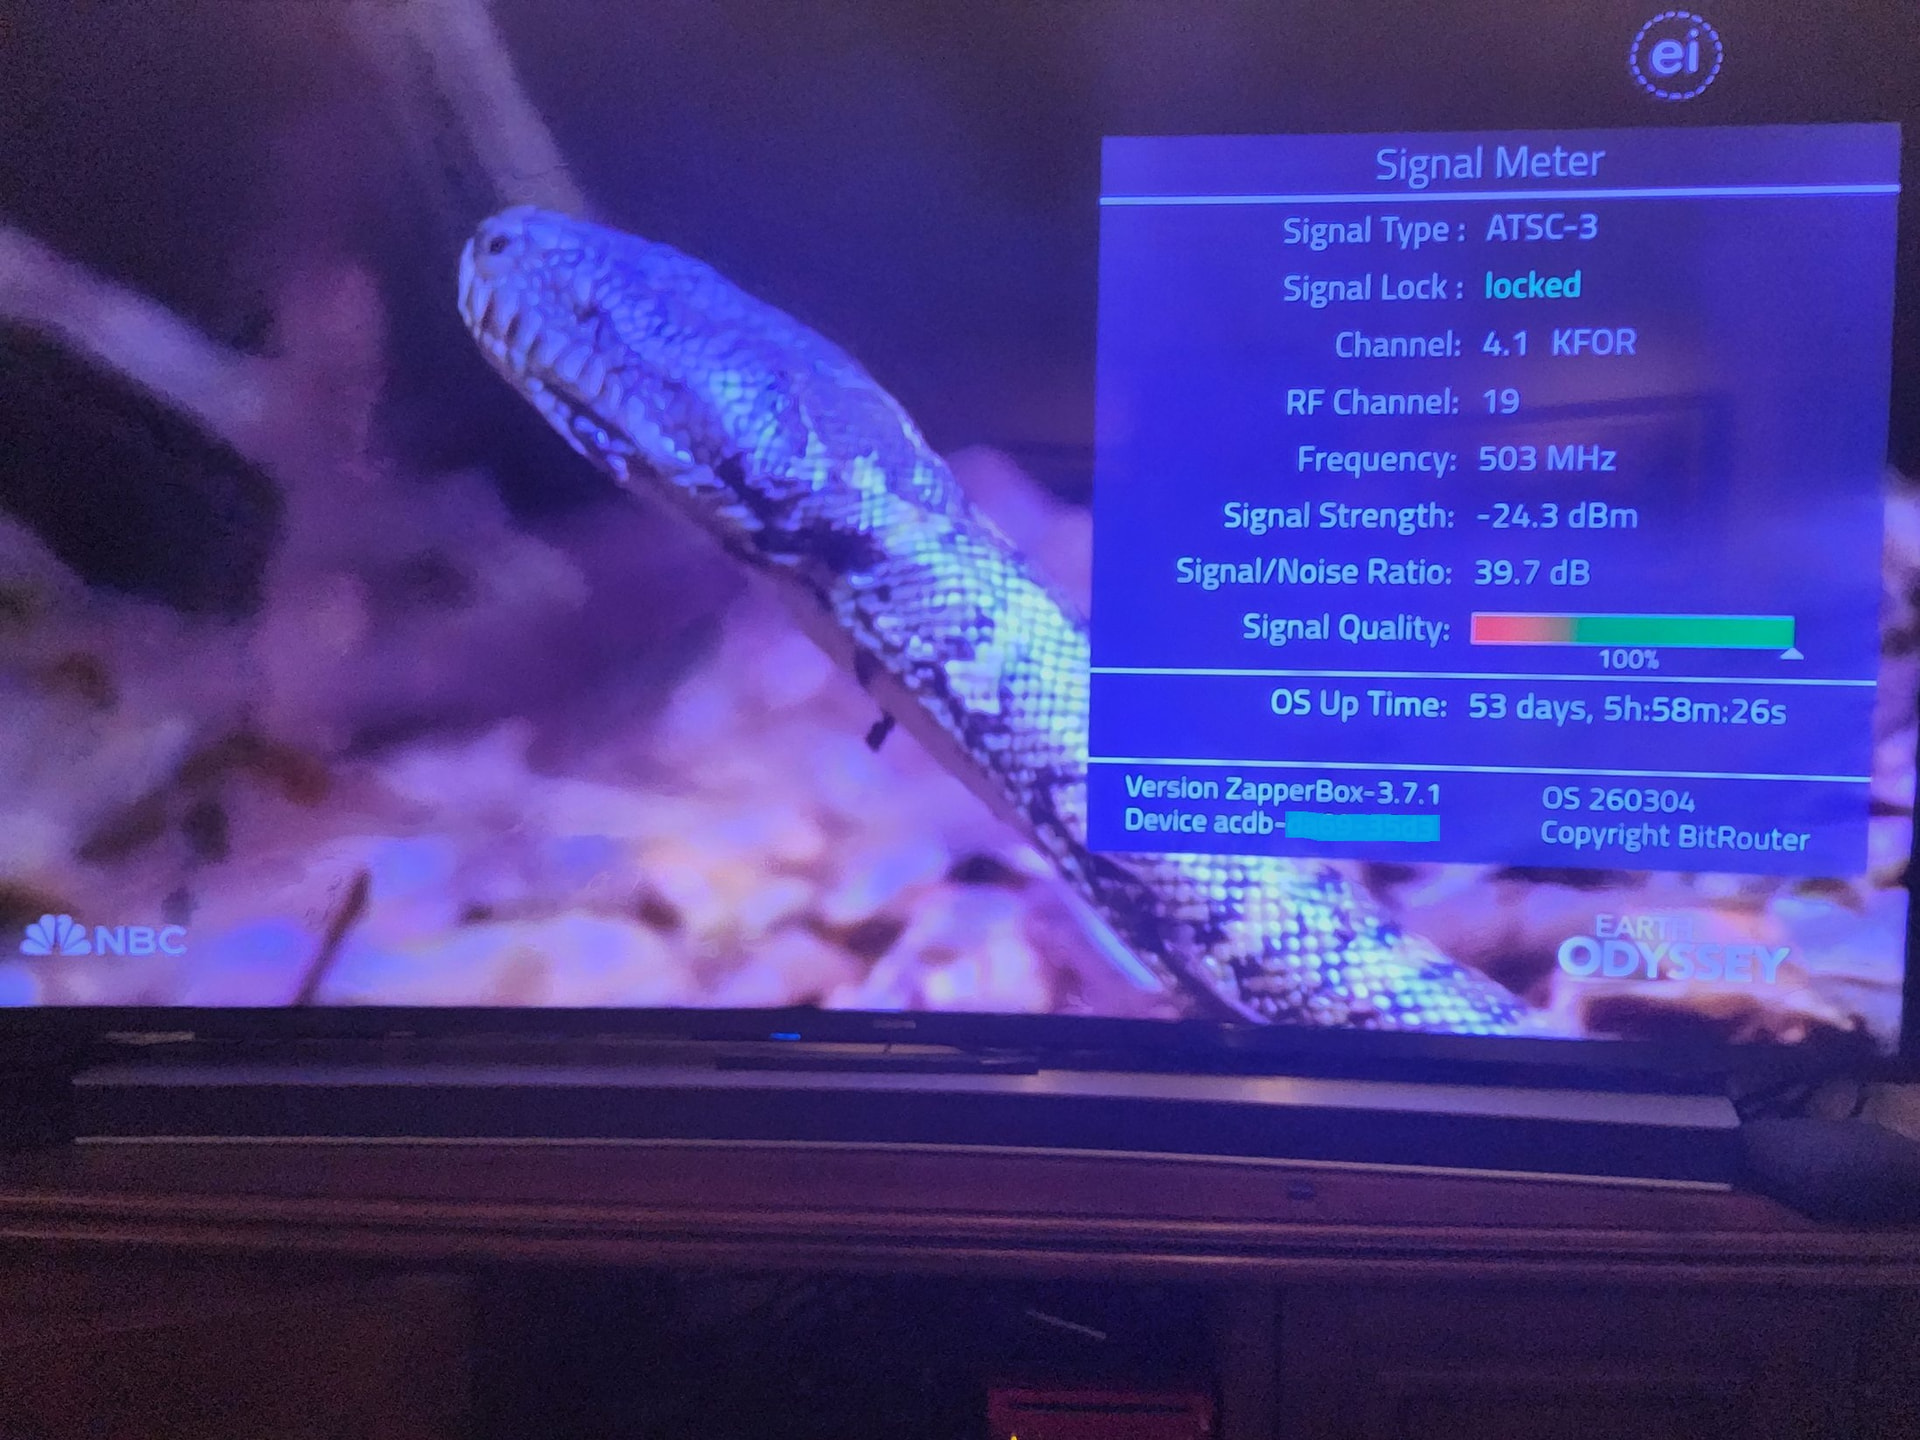
It also has a real time Signal Meter that can be called up at anytime.
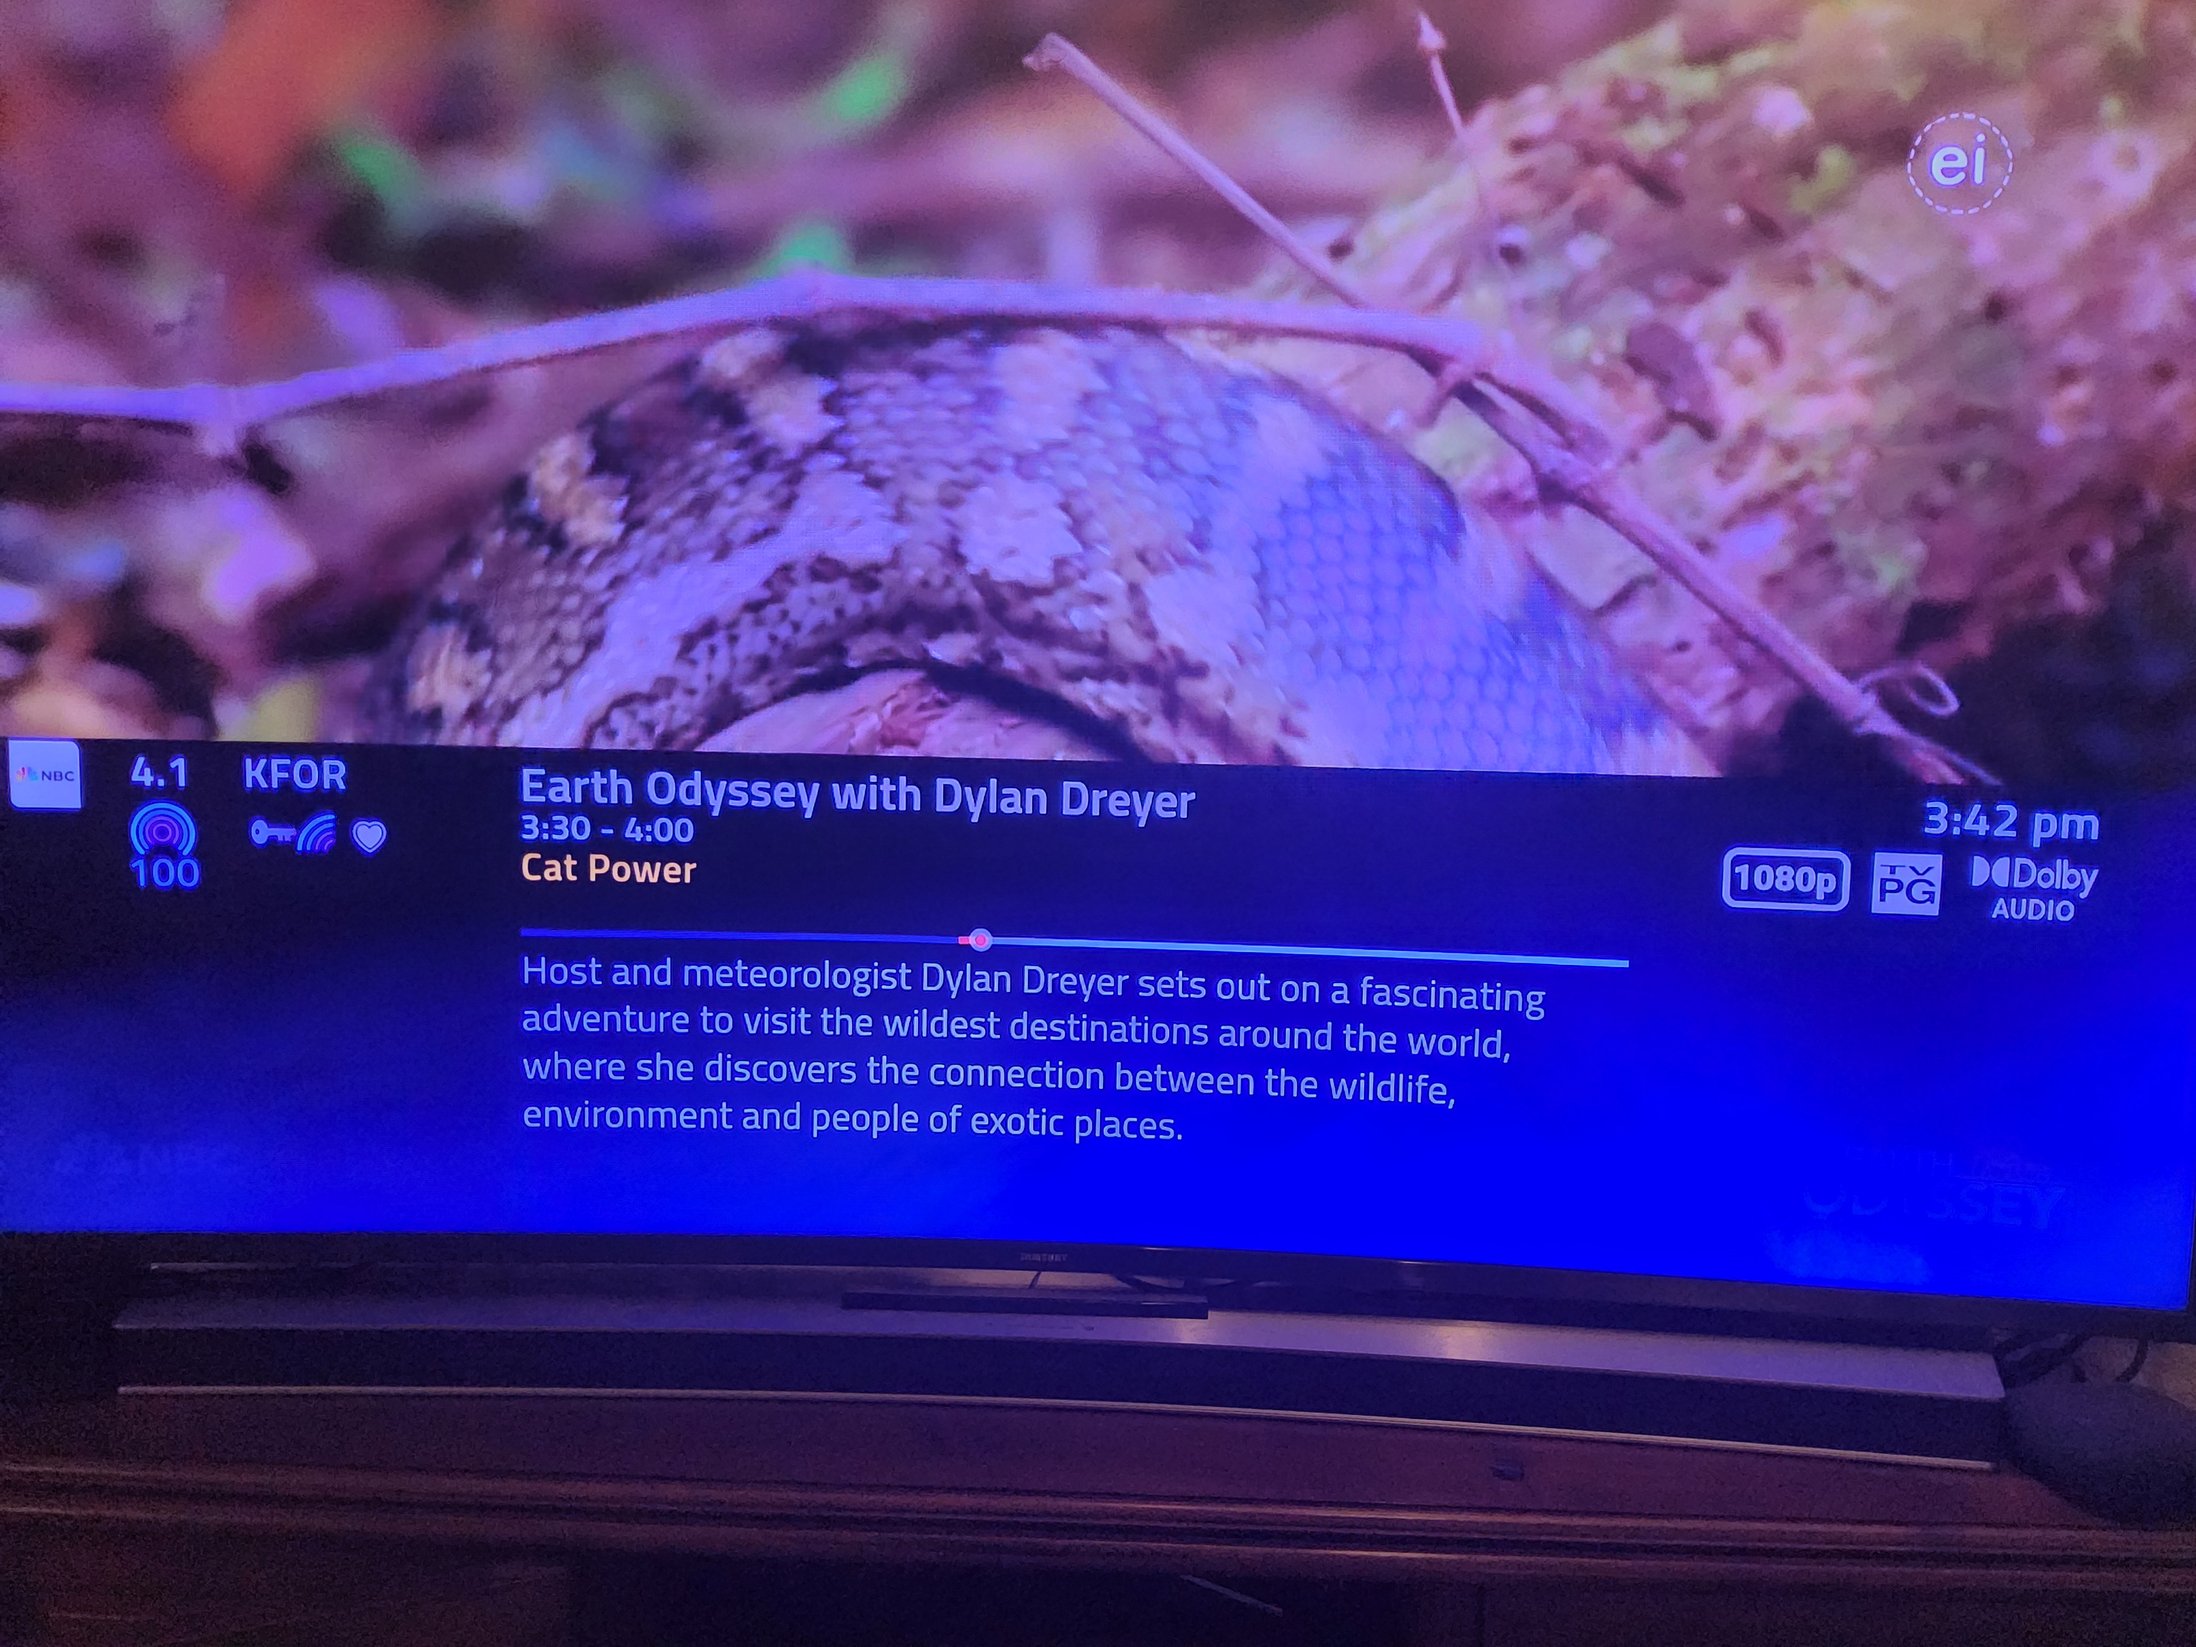
When changing channels or if you select the channel info button, it displays the current Signal Quality as a percentage. See the 100% under the channel number (4.1) on the left hand side. It also displays the colored rainbow arc under the station call letters (KFOR) for ATSC 3.0 stations and key symbol for DRM encrypted channels.
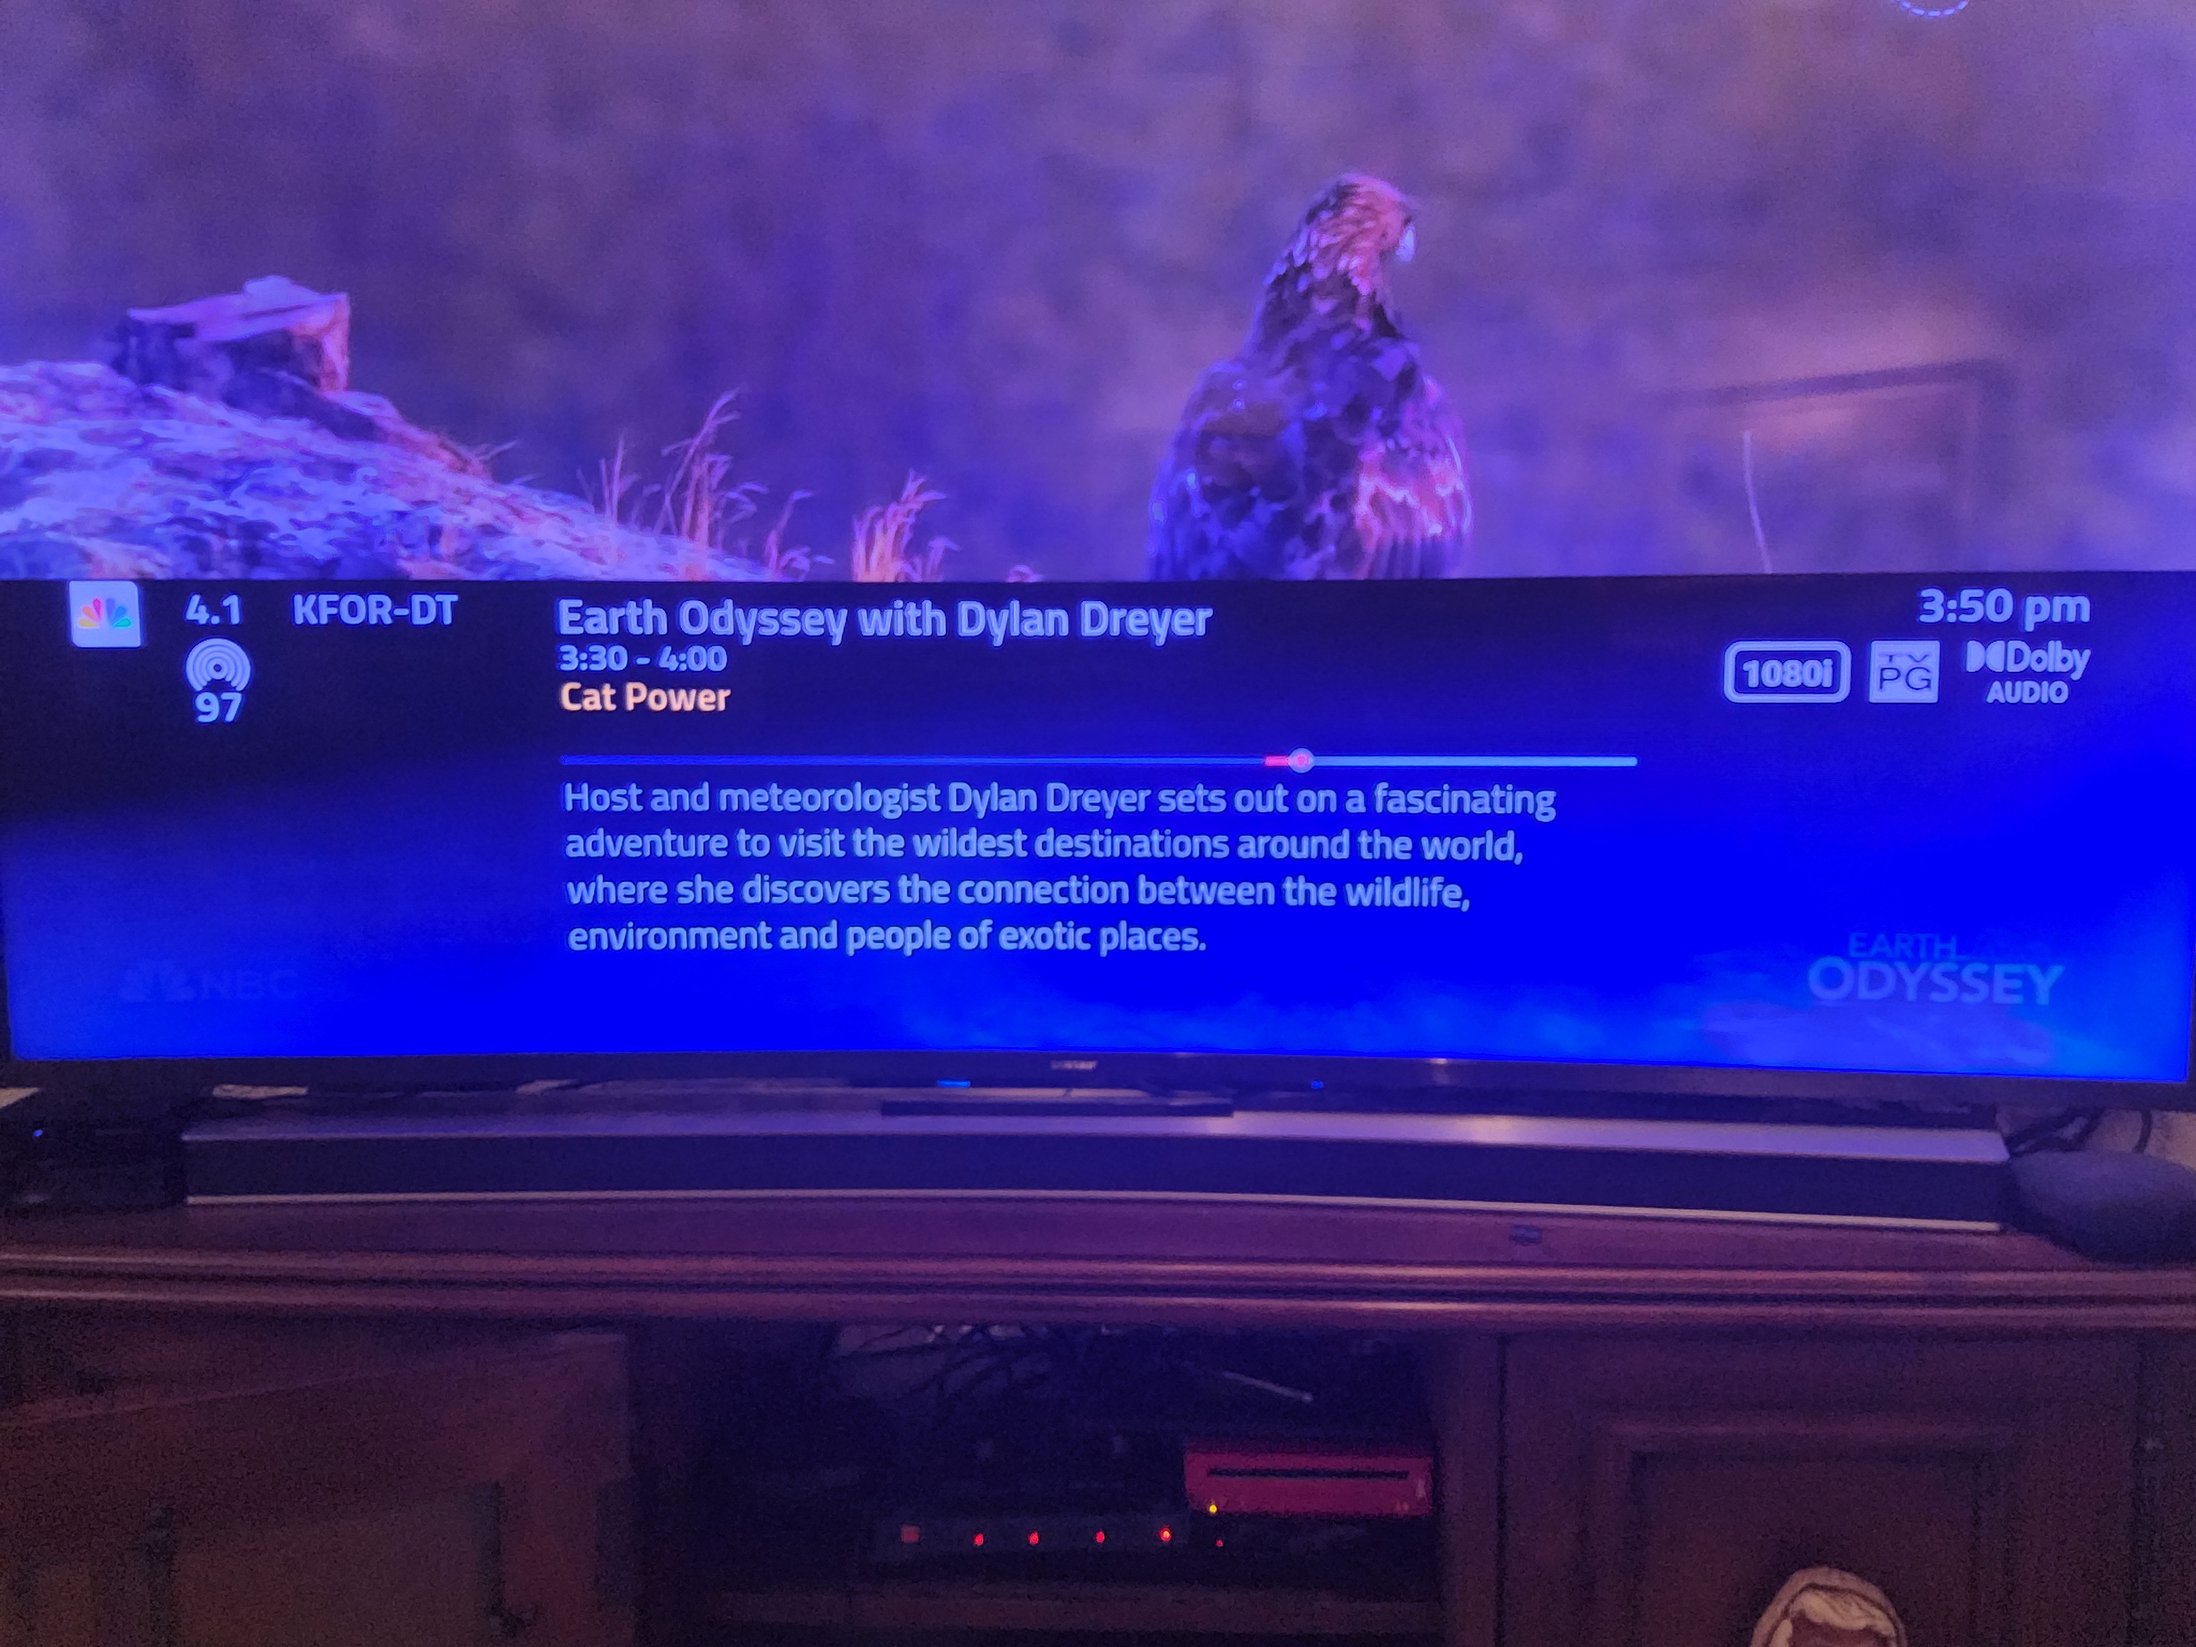
Below is the ATSC 1.0 channel info. Notice that the signal quality is 97% on this channel. Also you might notice that the ATSC 3.0 signal is 1080p and the ATSC 1.0 is 1080i.